Key Takeaways
- A representative 500 ml stainless thermos typically lands around 1.6-2.4 kg CO2e per unit cradle-to-FOB, depending on steel grade and packaging.
- Raw stainless steel usually contributes 55-70% of total embodied carbon; the cap, coating, and carton matter, but less than the metal.
- FOB China means you include factory-side packaging and inland/export handling, but not ocean freight unless your reporting boundary requires it.
- For ESG reporting, ask for material weights in grams, AQL records, REACH status, and an LCA drinkware model tied to real BOM data.
If you are building ESG reports, the first problem is not the math. It is the boundary. A water bottle carbon footprint can mean raw material only, factory gate, or a true cradle-to-FOB view that includes steel making, forming, finishing, packaging, and export to your port. Those are different numbers, and buyers get burned when suppliers mix them.
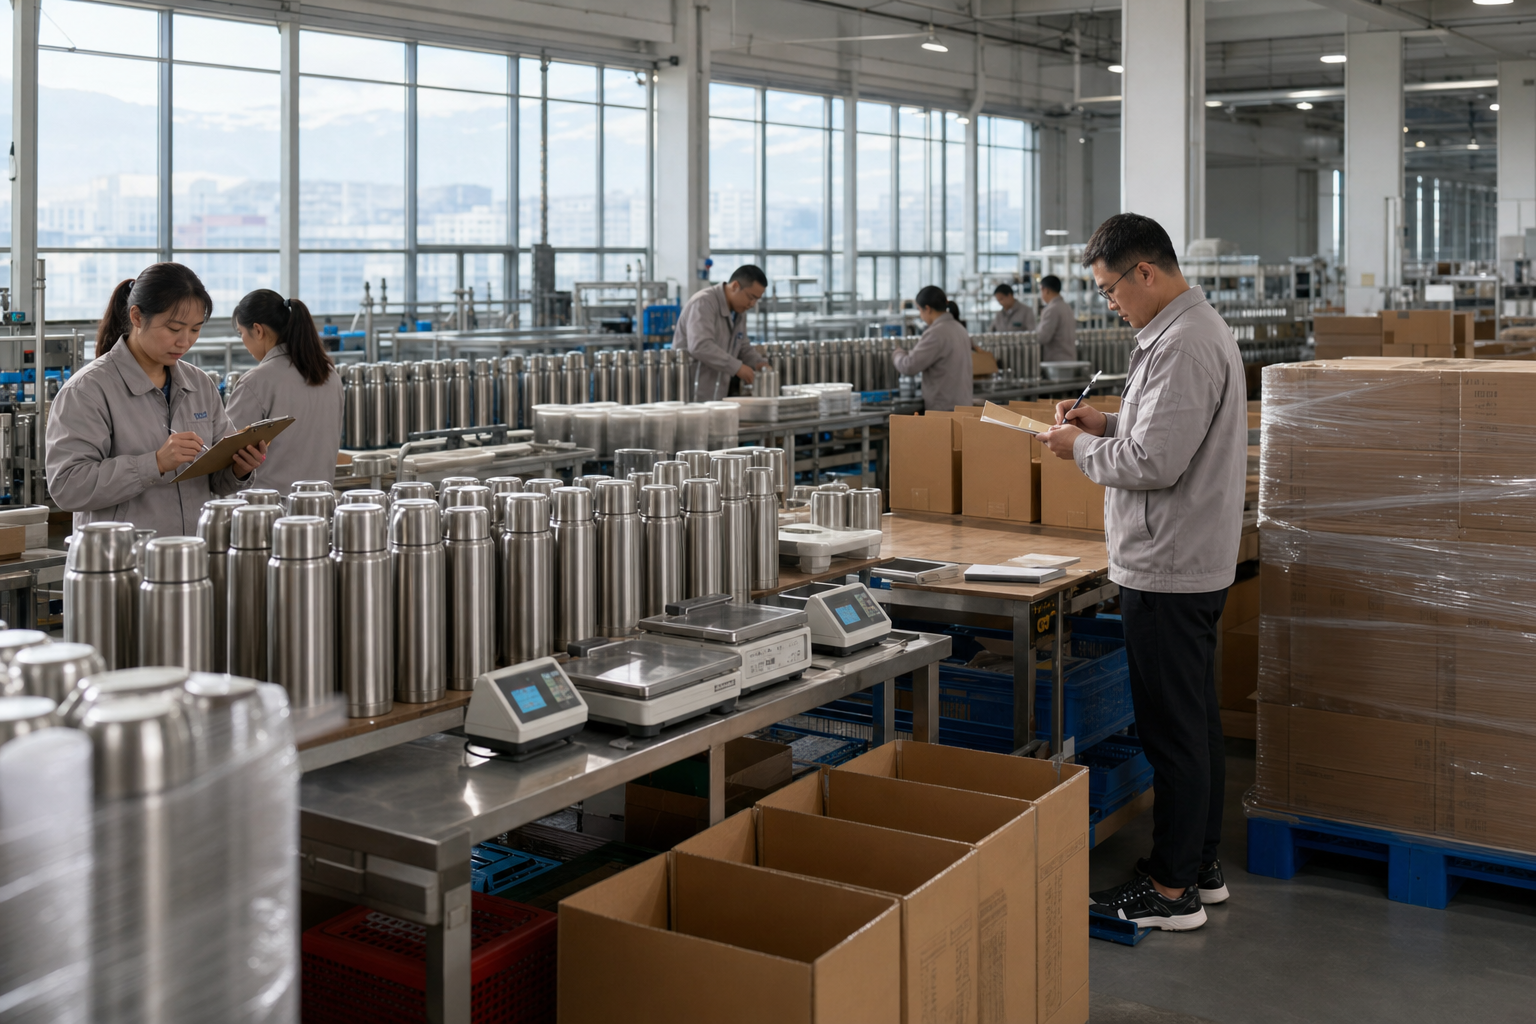
For a representative 500 ml stainless steel thermos made in Zhejiang, China, the embodied carbon is usually driven by the steel shell, liner, and cap, not the assembly line. At BottleForge Industrial, our Zhejiang factory runs around 1,200,000 units per month across multiple drinkware lines, so we see where the CO2 per unit comes from on the floor. QC pulled a shell sample at 0.45 mm last week, and the buyer flagged a PO typo on carton count, which is the kind of mess that ruins a clean LCA drinkware estimate. You need a bill of materials that names every part, not marketing copy.
What cradle-to-FOB really covers
Before you ask for a bottle carbon footprint, set the boundary. Cradle-to-FOB covers ore mining, steelmaking, tube forming, trimming, welding, polishing, vacuum sealing, printing, carton packing, and the point where the carton clears export loading under FOB China terms. It does not cover ocean freight, destination warehouse handling, or consumer use. If your ESG team uses another boundary, the numbers do not line up. We see that problem all the time.
For drinkware, this is the right cut because the biggest swing sits in the material stage. A stainless thermos looks simple on paper, but the upstream carbon is loaded into the steel, coating, and pack-out. We run the line with the same 500 ml spec and still get different CO2 per unit when one buyer asks for more virgin 304 stainless and another accepts higher recycled coil. Last month QC pulled the sample at 18.4 kg/carton because the buyer flagged the packing weight; that alone changed the result.
Use one functional unit and stick to it: one finished 500 ml vacuum-insulated thermos, packed for export, at FOB port. Then ask for the net weight by part: body shell, inner liner, cap assembly, silicone ring, finish, and outer carton. No weight sheet, no solid answer. We had a PO once that wrote “500mL” with a missing space and the carton count did not match the spec; the math does not work until the factory gives the exact grams.
Representative thermos bill of materials
Here is a reference build we ship: a 500 ml double-wall stainless thermos with 304 inner and outer shells, PP cap, silicone gasket, powder coat finish, and a kraft export carton. On the line, a common build uses 128 g of stainless steel, 22 g of PP, 3 g of silicone, 6 g of coating and print materials, and 38 g of paperboard packaging. Finished packed weight comes to about 197 g before pallets. We checked one pilot run at 196.4 g; QC pulled the sample after the buyer flagged a carton weight typo on the PO.
For carbon accounting, stainless steel drives the result. Depending on the supplier's melt route and recycled content, 304 stainless can range from 4.0 to 7.0 kg CO2e per kg of material. At 128 g of steel, that alone contributes 0.51 to 0.90 kg CO2e. The PP cap is much lower, around 0.05 to 0.09 kg CO2e. Carton and print add another 0.05 to 0.12 kg CO2e. The spread is wide because upstream steel is not one clean number, and the math does not work if you try to flatten it into a single “eco” label.
Buyers in Europe and North America should ask for the BOM first, then the carbon claim. Zhejiang factories that run export-grade drinkware at scale can usually send this bill of materials in 2-3 working days if the model is already tooled. If they need to pull old specs from a CAD file or a carton sample, give them a little more time. If they cannot produce it at all, the LCA drinkware claim is not ready for audit. We have seen this go sideways when a 304 line item was missing from the packing spec.
Where embodied carbon is concentrated
For a stainless thermos, embodied carbon sits in five places. Primary steel is the big one; on our line it usually takes 55-70% of cradle-to-FOB emissions. Tube forming and shell deep drawing come next, with press power, drawing oil, and scrap scrap-back to manage. Polishing and surface treatment add more, whether you run powder coating or spray paint. Vacuum assembly and leak testing draw less electricity, but the pumps still run. Packaging looks small until someone stuffs a 6-layer gift box into the carton.
In a factory model, we price it out like this, with the numbers tied to actual material takeoff and utility meters:
- Raw stainless steel: 0.51-0.90 kg CO2e
- PP cap and gasket materials: 0.07-0.12 kg CO2e
- Surface finish and printing: 0.08-0.18 kg CO2e
- Manufacturing electricity and compressed air: 0.12-0.25 kg CO2e
- Export packaging and carton: 0.05-0.12 kg CO2e
That lands a normal unit at 1.6-2.4 kg CO2e cradle-to-FOB. A heavier body, more virgin metal, or a fancy gift box pushes it up fast; we have seen a 380 g spec beat a 260 g spec by a wide margin. Higher recycled content steel and a plain carton pull it down. The math does not work any other way. This is why a carbon footprint model is useful only when you can trace the lever back to the BOM and the line record.
Buyers should care less about the lowest headline number and more about whether the supplier can show the inputs. We’ve had POs where the carton size was typed wrong by 10 mm, and the freight carton count changed the whole footprint. A number without a BOM is not an ESG metric; it is decoration.
How we model CO2 per unit
A useful model says what we left out. Office overhead, sales travel, and the customer use phase stay outside cradle-to-FOB unless your method asks for them. That is standard LCA work for drinkware. We see the buyer flag this on day one, then the math gets cleaned up fast.
If your team needs the numbers to match across suppliers, lock the assumptions: 500 ml volume, 128 g metal mass, 38 g carton, FOB Ningbo or Shanghai, China grid electricity factor for the reporting year, and one scrap allocation method. We can pull that from the line, but only when the PO spells it out in writing. QC pulled the sample at 2.5 mm wall thickness last week, and one typo on the carton spec changed the whole calculation.
Packaging and transport distortions
Packaging rarely drives the stainless thermos footprint, but an oversized carton will skew the report fast. A plain kraft carton with one divider usually lands around 0.03-0.05 kg CO2e per unit. A gift box with laminated print, foam inserts, and a sleeve can push that to 2x or 3x. We had one buyer ask for a 1,000-set PO with a box size typo, and the outer carton jumped 8 mm on each side; the math got ugly. If you sell on retail shelves or through Amazon FBA, packaging often gets designed for shelf appeal first and carton efficiency second. That is the wrong order for ESG.
Transport gets blown out of proportion too. Under a cradle-to-FOB boundary, inland truck haul from a Zhejiang factory to Ningbo port is usually modest, often below 0.03 kg CO2e per unit unless the truck is half empty or the route is messy. Ocean freight to Europe or North America stays outside FOB accounting, though some buyers want a delivered-to-warehouse figure. In that case, freight can add 0.05-0.20 kg CO2e per unit depending on route, vessel space, and consolidation. We run this split all the time. Do not mix the two boundaries in one table.
If you are building supplier scorecards, ask for three separate numbers: product manufacturing emissions, export packaging emissions, and freight emissions. That split lets you compare a bottle made in Zhejiang with one sourced elsewhere in China or overseas. It also keeps a bad freight lane from being pinned on the line. QC pulled the sample once and found the carton test passed, but the forwarder booked a partial load anyway, which is a logistics problem, not a factory problem.
What buyers should request from suppliers
ESG reporting teams should ask for documents, not promises. A serious China factory should send a material breakdown, line electricity data, packaging weights, and a method note that shows the boundary and emission factors used. If the supplier says compliance is covered, check whether the materials meet REACH, and ask for the actual audit status on ISO 9001, ISO 14001, or BSCI where it applies. Those papers do not replace an LCA. They do tell you whether the plant runs in a controlled way or is guessing.
Ask for these items in your RFQ or supplier questionnaire:
- Finished unit weight in grams and component-level BOM
- Annual or batch-specific electricity consumption for the line
- Scrap rate and regrind/recovery method
- Packaging spec with carton weight and dimensions
- Declared recycled content for stainless steel, if available
- Method statement for cradle-to-FOB and CO2 per unit calculation
One practical sign of maturity is whether the factory can tie the claim to production records. We run this at our Hangzhou plant in Zhejiang: SKU weights, mold revision history, and packing standards all sit in batch records, and QC pulled the sample before packing on the same line. That level of traceability matters more than a glossy sustainability page. It keeps a water bottle carbon footprint number alive when the buyer flags it six months later and asks for backup. The wrong question is "Can you make a greener claim?" The better one is "Can you prove it with the PO, the meter reading, and the shipment record?"
How to reduce footprint without weakening the product
You do not cut embodied carbon by making a weak bottle. You cut it by trimming dead weight, using less virgin steel, and keeping the pack simple while the thermos still passes drop and leak checks. On a 500 ml stainless thermos, we usually start with wall thickness. If the drawing allows 0.35 mm instead of 0.40 mm in the right section, that is a real material cut. A 5 g reduction in stainless steel can save roughly 0.02-0.04 kg CO2e per unit, depending on the upstream factor. Across 500,000 units, the math gets hard to ignore. We ship the line, not the slogan.
Design changes need test data. Thin the wall too far and vacuum performance slips; the buyer flags it fast. Push the coating too hard and you see more rework at the spray booth. QC pulled the sample last week and found three pinholes on a 24-hour leak test, which is the kind of problem that wipes out any carbon gain. In practice, the lowest-footprint option is the one that ships at spec with low scrap. A factory in Zhejiang with stable forming and welding lines can usually hold tolerance tight enough to cut rework by 1-2 percentage points. That matters more than a green label on the carton.
For brands selling into Europe and North America, this is the wrong question to ask: “Can we make it green?” Ask, “Can we document the steel grade, recycled content, and process change without hurting leakage rate, drop test performance, or retail damage rate?” We once saw a PO with the wrong sleeve code typed as 500 ml instead of 550 ml, and the whole carton mark-up had to be redone. That kind of slip is small on paper and expensive on the floor. This is a supply chain issue, not a slogan.
Request a documented CO2 per unit model
Send your SKU spec, target market, and annual volume. We will map the BOM, packaging, and FOB boundary into a transparent LCA drinkware estimate from Zhejiang, China.
Frequently asked questions
What is a realistic carbon footprint for one stainless thermos?
For a representative 500 ml stainless thermos packed FOB China, a realistic cradle-to-FOB range is about 1.6-2.4 kg CO2e per unit. The spread depends mainly on the steel emission factor, recycled content, weight, and packaging. If the bottle uses heavier gauge steel, premium gift packaging, or virgin material, the number moves up quickly. If you have a lighter design and documented recycled content, it moves down. For ESG reporting, publish the midpoint and the range, not a single rigid figure. That is the honest way to report LCA drinkware data.
Does FOB include ocean freight in the water bottle carbon footprint?
No, not under a standard FOB China boundary. FOB stops at the point the goods are loaded for export or otherwise handed over according to the agreed trade term. Ocean freight, destination inland trucking, and warehouse storage are outside the boundary unless your reporting method explicitly requires them. If your team needs a delivered-to-warehouse number, calculate freight separately. For a typical consolidated shipment from Ningbo to Europe, freight may add 0.05-0.20 kg CO2e per unit, but that should never be mixed into a pure cradle-to-FOB figure.
What data do I need from the factory for an LCA drinkware audit?
Ask for a component-level BOM in grams, actual scrap rate, monthly electricity use for the relevant line, packaging weights, recycled content declarations, and the calculation method used for CO2 per unit. Also request product photos, carton dimensions, and any test or compliance records like REACH, ISO 9001, ISO 14001, or BSCI if available. A factory in Zhejiang should be able to provide this for an established SKU within 2-3 working days. If they cannot, the dataset is probably too weak for ESG reporting.
Why is stainless steel such a big part of embodied carbon?
Because stainless steel is energy-intensive before it ever reaches the factory. The upstream melt, refining, alloying, and rolling stages carry a high emissions load, often 4.0-7.0 kg CO2e per kg depending on the source and recycled content. Since a typical thermos may use 120-150 g of steel, most of the bottle’s water bottle carbon footprint sits in the metal, not in assembly. That is why changing packaging alone rarely solves the problem. Material choice and mass reduction matter far more.
Can recycled stainless steel materially lower CO2 per unit?
Yes, if the supplier can document it. Moving from primarily virgin steel to higher recycled content can cut the steel portion of the footprint meaningfully, sometimes by 15-40% for that component depending on the route and data source. On a 500 ml thermos, that can reduce total cradle-to-FOB emissions by roughly 0.15-0.40 kg CO2e per unit. The exact gain depends on the final steel factor, total metal weight, and whether the factory can keep yield losses low. Always ask for the evidence, not just the claim.